
U.S. stock markets are experiencing sharp volatility. The Fear and Volatility Index (VIX) surged to 60 points on Monday, April 7, 2025, before falling back to 33 points on Wednesday, April 9 — marking the largest single-day drop in the index’s history. The VIX then rebounded to 50 points yesterday, with expectations that volatility will remain elevated in the coming period.
U.S. stock indices closed with widespread losses yesterday. The S&P 500 declined by 3.46%, the Nasdaq 100 fell 4.19%, the Dow Jones dropped 2.50%, and the Russell 2000 — which tracks small and mid-cap stocks — declined by 4.27%.
The primary driver behind this extreme volatility is the series of decisions and statements from President Donald Trump, particularly the tariffs he imposed on over 180 countries on Wednesday, April 2. These tariffs varied in rate and included both allies and rivals. The focus, however, remains on China, which was hit with a cumulative tariff rate of 145%. Meanwhile, Trump temporarily suspended tariffs on the remaining countries for 90 days, citing their lack of retaliatory measures, in an effort to open the door to negotiations.
Amid ongoing uncertainty surrounding Trump’s trade policies — along with concerns over insider trading, market manipulation, and unclear monetary policy from the Federal Reserve — fears are intensifying across markets. The Fed’s March meeting minutes warned of the risk of stagflation: rising inflation alongside slowing growth and declining employment.
Concerns are also mounting over U.S. fiscal policy, especially after government debt surpassed $36 trillion. Rising interest payments on debt, a widening fiscal deficit, and a surge in the five-year Credit Default Swap (CDS) to its highest level since January 2024 are further exacerbating investor anxiety.
Citigroup has advised caution, saying that this is not an appropriate time to invest in U.S. equities given the current market turbulence.
It is worth noting that headline consumer price inflation (CPI) slowed in March to an annual rate of 2.4%, lower than both expectations (2.5%) and the previous reading (2.8%). Core CPI (excluding food and energy) also declined to 2.8% year-over-year, below expectations of 3.0% and the previous figure of 3.1%. While this could potentially encourage the Fed to consider rate cuts, the market reaction remained subdued, overshadowed by the dominating factor: Trump’s tariffs and unpredictable tweets.
Bond Markets:
The U.S. bond market is also experiencing notable volatility. The yield on 10-year Treasury notes climbed to around 4.50%, up from 3.86% on April 4 — a nearly 17% increase, signaling strong selling pressure despite Treasuries traditionally being considered safe-haven assets. Several factors are contributing to this trend:
- Investors liquidating positions to cover losses in other assets, such as equities, due to margin calls
• Large-scale selling by major U.S. bondholders, led by China
• A flight to cash, which is often seen as king during times of crisis
Meanwhile, the yield on 30-year Treasury bonds surpassed 5.00% two days ago — the highest level since November 1, 2023 — further underscoring the ongoing selling pressure.
Given Trump’s preference for lower interest rates (and therefore lower bond yields) to keep U.S. government borrowing costs down, the question arises: Have these rising yields influenced Trump’s decision to pause new tariffs for 90 days?
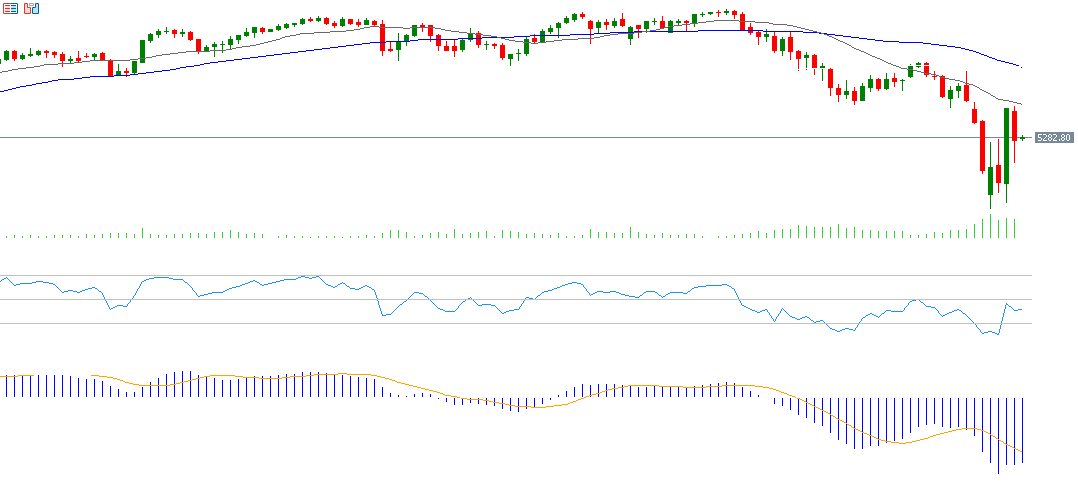
From a Technical Perspective:
- The 50-day moving average (blue) is converging with the 200-day moving average (yellow) at the 5,775 and 5,755 levels, respectively. A downward break could signal a bearish trend reversal for the S&P 500.
• The Relative Strength Index (RSI) currently stands at 40, indicating negative momentum.
• The MACD indicator shows a bearish crossover between the MACD line (blue) and the signal line (orange), reinforcing the negative outlook.
Please note that this analysis is provided for informational purposes only and should not be considered as investment advice. All trading involves risk.

